The new climate stripes? How creativity can inspire environmental action
Without context, vast numbers are meaningless. Data can be incredibly dry, abstract and difficult to visualise. But sometimes scientists find clever ways of presenting complex information in creative, eye-catching and more tangible forms.
In 2019, Ed Hawkins, a climate professor at the University of Reading, created “climate stripes” to illustrate the global average temperature for each year since 1850 in the form of a coloured stripe. Now a cultural icon, these simple blue and red graphics have appeared on football kits, music festival stages and even a Tesla.
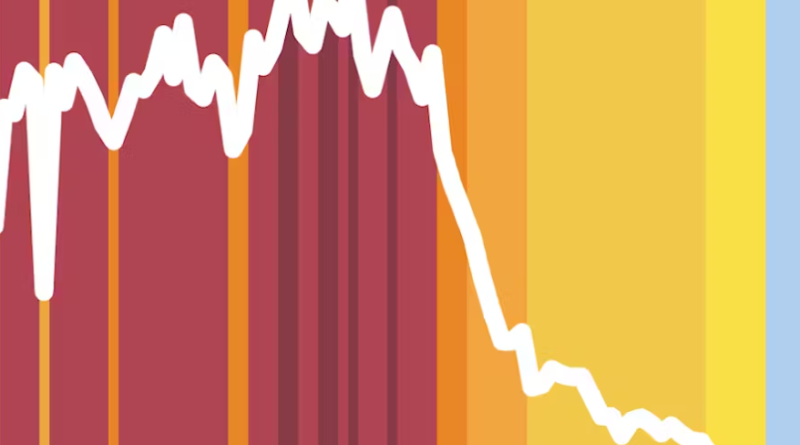
Last week, scientists launched new air-quality stripes to depict how concentrations of ultrafine particles known as particulate matter have changed in 176 cities worldwide since 1850. The global threat of air pollution is often considered an invisible killer, but these colourful diagrams show some stark global contrasts. Some offer hope.
“My research has often focused on communicating the impacts of climate change to new audiences. The more people that see and understand this huge problem, the better chance we have of solving it.”
For critical issues like the climate crisis and air pollution, visual storytelling is a powerful tool. By translating statistics into colourful diagrams that tell a story, changing trends become more apparent, relatable and relevant.
Jim McQuaid, an atmospheric scientist at the University of Leeds who helped create the new air quality stripes, remembers the steel furnace smell once common in Britain, which decreased drastically after the Clean Air Act was introduced in 1956.
London’s air quality stripes illustrate how the Industrial Revolution in Britain triggered various smog events, one of which killed up to 12,000 people in 1952. But stripes switch from red and orange to more yellow (moderate) and sky blue (fair) as industrial and transport emissions were targeted by the subsequent Clean Air Act in 1993.
The Beijing stripes show how concentrations of particulate matter rose rapidly with China’s industrial development from the mid-20th century.
But when the 2008 Olympic Games took place, drastic steps were taken – factories were shut or moved away from the city while millions of cars were taken off the road. Dark brown (extremely poor) air quality stripes revert to a lighter shade of orange (poor air quality).
Climate drivers
Climate and air pollution are intrinsically linked. Many air pollutants are also known as “climate forcing agents” – they drive the climate crisis. Sooty components of particulate matter known as black carbon have a warming effect.
But other pollutants, notably human-made aerosols including sulphate from industrial chimneys, have the opposite effect. These small particles of pollutants are left suspended in the air and can seed clouds.
More particulate matter means more clouds and crucially smaller cloud droplets – this increases the amount of sunlight reflected back into the atmosphere. As scientists at the University of Oxford have found, “all of this increases the amount of sunlight that clouds scatter back to space instead of being absorbed by the Earth”.
By slightly cooling the climate, human-made aerosols mask some of the warming from greenhouse gases – this is known as “global dimming”. But that’s far from good news, because aerosols and their cooling effect are short-lived.
“While the CO₂ emitted into the atmosphere today from cars and coal power stations will still be there centuries later, the aerosols emitted as air pollution will cease to have an influence a month from now,” write Peter Manshausen, Duncan Watson-Parris and Philip Stier from the University of Oxford.
“This means that as soon as we stop emitting aerosols, their buffering effect on climate change disappears, while the greenhouse gases in our atmosphere will continue to heat the planet.”
Mapping pollution
In Mukuru, an informal settlement in Nairobi, Kenya, scientists have been working closely with the local community to raise awareness about the severe health effects of air pollution through theatre, storytelling, photography and drawing. Artists from the Mukuru-based Wajuuku Arts Centre painted maps on canvas and took these out into the community so that residents could identify pollution hotspots and sources.
Using creativity was key to the project’s success, according to researchers Cressida Bowyer at the University of Portsmouth and Heather Price at the University of Stirling.
“If we had gone into the community with aims and ambitions that had already been decided according to the commonly acknowledged causes of air pollution (traffic, industry, cooking methods) we may not have had space to reveal or acknowledge these other sources,” they say.
“Instead, we identified issues that the community recognises as indirect causes of air pollution, such as workers’ rights, alleyways between dwellings that are too narrow for fire-fighting equipment, and poor waste management.”
Even between neighbourhoods, the pollution picture can vary. The best visual tools represent as much nuance as possible.
James Cheshire, professor of geographic information and cartography at University College London points out that uncertainty is difficult to communicate in any one single image, chart or graph.
“One misconception about the climate crisis is that warming will be uniform across the world,” he says, explaining that oversimplified graphics risk missing the “complex patchwork of effects” behind the headline figures. “Maps can be an invaluable weapon against this misunderstanding.”
Scrolling through time or space is a great way to capture intricacies and highlight anomalies at different scales. Visual storytelling offers hope, not only by demonstrating progress but also by connecting more people with the problem and amplifying possible solutions.
Source: theconversation.com


